Rancher 2.5.x monitoring and alerting with MS Teams
Posted on September 9, 2021 by Adrian Wyssmann ‐ 5 min read
Installing monitoring and configuration with Rancher is quite easy, but in combination wit alerting for MS Teams some guidance might be helpful. I guide you trough the process of the complete installation and configuration
Introduction
The rancher-monitoring operator, introduced in Rancher v2.5, is powered by
Prometheus,
Grafana,
Alertmanager, the
Prometheus Operator, and the
Prometheus adapter.
Rancher’s solution allows users to:
- Monitor the state and processes of your cluster nodes, Kubernetes components, and software deployments via Prometheus, a leading open-source monitoring solution.
- Define alerts based on metrics collected via Prometheus
- Create custom dashboards to make it easy to visualize collected metrics via Grafana
- Configure alert-based notifications via Email, Slack, PagerDuty, etc. using Prometheus Alertmanager
- Defines precomputed, frequently needed or computationally expensive expressions as new time series based on metrics collected via Prometheus (only available in 2.5)
- Expose collected metrics from Prometheus to the Kubernetes Custom Metrics API via Prometheus Adapter for use in HPA (only available in 2.5)
Installation of Monitoring
Install Operator
Go to “Apps & Marketplace” in “Cluster Explorer” and select “Monitoring”
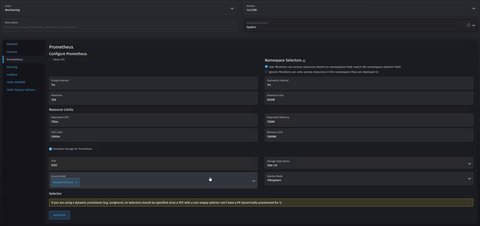
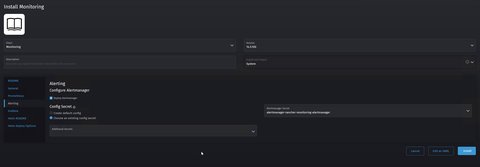
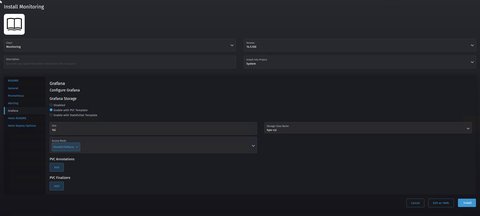
Configure the monitoring as follows


Click on “Edit as YAML” and add the following to
prometheus.prometheusSpec.additionalScrapeConfigs(see Rancher Docs: Selectors and Scrape Configs) to scrape traffic from istio-enabled namespaces.- job_name: 'istio/envoy-stats' scrape_interval: 15s metrics_path: /stats/prometheus kubernetes_sd_configs: - role: pod relabel_configs: - source_labels: [__meta_kubernetes_pod_container_port_name] action: keep regex: '.*-envoy-prom' - source_labels: [__address__, __meta_kubernetes_pod_annotation_prometheus_io_port] action: replace regex: ([^:]+)(?::\d+)?;(\d+) replacement: $1:15090 target_label: __address__ - action: labelmap regex: __meta_kubernetes_pod_label_(.+) - source_labels: [__meta_kubernetes_namespace] action: replace target_label: namespace - source_labels: [__meta_kubernetes_pod_name] action: replace target_label: pod_nameOptionally you may add Ingress configurations to the yaml, so developers can access it without going over the Rancher UI
Ingress for Grafana:
grafana:
...
ingress:
    annotations: {}
    enabled: true
    hosts:
    - grafana.intra
    labels: {}
    paths:
    - /
    tls: []
Ingress for Alertmanager
alertmanager:
...
ingress:
    annotations: {}
    enabled: true
    hosts:
    - alertmanager.intra
    labels: {}
    paths:
    - /
    tls: []
Ingress for Prometheus:
prometheus:
...
ingress:
    annotations: {}
    enabled: true
    hosts:
    - prometheus.intra
    labels: {}
    paths:
    - /
    tls: []
Click “Install”
Now we have all monitoring components installed and are ready to configure the alerting.
Configure Alerting for MS Teams
Incoming Webhooks in MS Teams
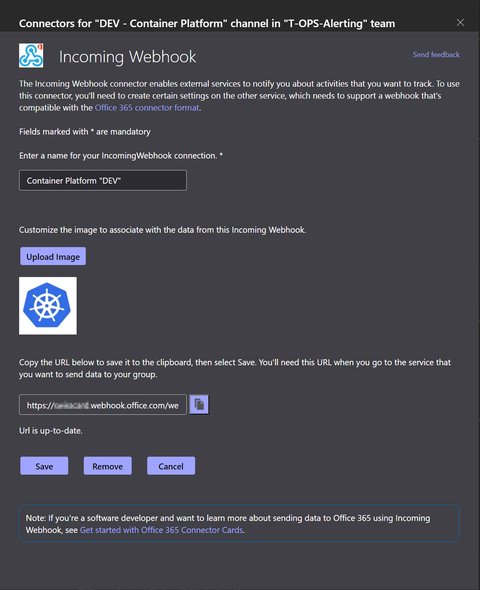
First you need to create a Incoming Webhook in your MS Teams “Team”. We name the connector as follows in order to see where it is used:
Container Platform Cluster "CONTEXT"-CONTEXTis the cluster name e.gDEV:
Copy the URL
Click Done
Install Alerting Drivers
As we are using MS teams the steps required are slightly different as if you would use Slack. This is due to the need of the need of rancher-alerting-drivers. Thus we have to do the following steps
Install “Alerting Drivers” via Apps & Marketplace, with the following options
- Chart Options:
[x] Enable Microsoft Teams - Namespace:
cattle-monitoring-system
- Chart Options:
Configure
prom2teams. You can do this either via the Rancher UI or as I prefer, to use a separate manifest file, as follows:apiVersion: v1 data: config.ini: |- [HTTP Server] Host: 0.0.0.0 Port: 8089 [Microsoft Teams] msteams-alert-1: https://xxxx.webhook.office.com/webhookb2/xxxx/IncomingWebhook/xxx msteams-alert-2: https://xxxx.webhook.office.com/webhookb2/xxxx/IncomingWebhook/xxx [Log] Level: INFO [Template] Path: /opt/prom2teams/helmconfig/teams.j2 teams.j2: |- {%- set theme_colors = { 'resolved' : '2DC72D', 'critical' : '8C1A1A', 'severe' : '8C1A1A', 'warning' : 'FF9A0B', 'unknown' : 'CCCCCC' } -%} { "@type": "MessageCard", "@context": "http://schema.org/extensions", "themeColor": "{% if status=='resolved' %} {{ theme_colors.resolved }} {% else %} {{ theme_colors[msg_text.severity] }} {% endif %}", "summary": "{% if status=='resolved' %}(Resolved) {% endif %}{{ msg_text.summary }}", "title": "Prometheus alert '{{ msg_text.name }}' {% if status=='resolved' %}(Resolved) {% elif status=='unknown' %} (status unknown) {% else %} triggered {% endif %}", "sections": [{ "activityTitle": "{{ msg_text.summary }}", "facts": [{% if msg_text.name %}{ "name": "Alert", "value": "{{ msg_text.name }}" },{% endif %}{% if msg_text.instance %}{ "name": "In host", "value": "{{ msg_text.instance }}" },{% endif %}{% if msg_text.severity %}{ "name": "Severity", "value": "{{ msg_text.severity }}" },{% endif %}{% if msg_text.description %}{ "name": "Description", "value": "{{ msg_text.description }}" },{% endif %}{ "name": "Status", "value": "{{ msg_text.status }}" }{% if msg_text.extra_labels %}{% for key in msg_text.extra_labels %},{ "name": "{{ key }}", "value": "{{ msg_text.extra_labels[key] }}" }{% endfor %}{% endif %} {% if msg_text.extra_annotations %}{% for key in msg_text.extra_annotations %},{ "name": "{{ key }}", "value": "{{ msg_text.extra_annotations[key] }}" }{% endfor %}{% endif %}], "markdown": true }] } kind: ConfigMap metadata: name: rancher-alerting-drivers-prom2teams namespace: cattle-monitoring-systemRemarks
- The section
[Microsoft Teams]in theconfig.inicontains configurations for the Incoming Webhooks, using the url from the configuration in MS Teams - The
teams.j2is slightly adjusted to the original one.
- The section
As we are sitting behind a proxy, we have to manually add the proxy configuration to the
rancher-alerting-drivers-prom2teamsdeployment:... - env: ... - name: HTTP_PROXY value: 'http://myproxy.intra:8888' - name: HTTPS_PROXY value: 'http://myproxy.intra:8888' ...You can check now if the setup works, using the following command:
context=xxxx;kubectl logs $(kubectl get pods -n cattle-monitoring-system -l app.kubernetes.io/name\=prom2teams -o name --no-headers=true --context $context) -n cattle-monitoring-system --context $contextIf there is an issue, you would see it in the logs.
Add Receivers
Once the pods are running, one has to configure the Receivers - unfortunately this has to be done manually in the Rancher UI:
Yes, you can add routes and receivers via kubectl and base64 but it’s not recommended. They are stored in the alertmanager secrets under the cattle-monitoring namespace for Monitoring v2.
So we create for each incoming webhook a route, example:
spec:
  name: MS Teams T-OPS-Alerting "DEV - Container Platform"
  email_configs:
  slack_configs:
  pagerduty_configs:
  opsgenie_configs:
  webhook_configs:
    - url: >-
        http://rancher-alerting-drivers-prom2teams.cattle-monitoring-system.svc:8089/v2/msteams-alert-1
      http_config:
        tls_config:
          cert_file: ''
          key_file: ''
        proxy_url: ''
      send_resolved: true
Take attention on the url as this points to the rancher-alerting-drivers-prom2teams-pod using the connection defined in the prom2teams-configuration as explained above. Inthis case we use msteams-alert-1.
Add Routes
At last we need a
Route which tells which alerts shall appear in the channel. We want all default alerts in it, so we match the namespace: cattle-monitoring-system:
spec:
  receiver: MS Teams T-OPS-Alerting "DEV - Container Platform"
  group_by:
  group_wait: 30s
  group_interval: 5m
  repeat_interval: 4h
  match:
    namespace: cattle-monitoring-system
  match_re:
    {}
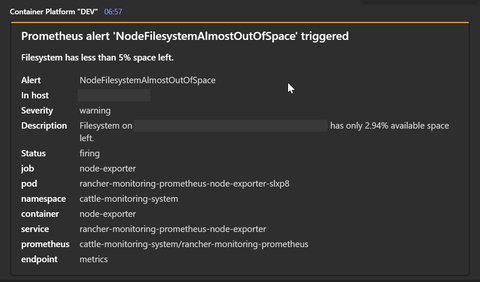
And voilà, here you have your alerts:
