Rancher 2.5.x v2 logging using splunk
Posted on September 9, 2021 by Adrian Wyssmann ‐ 5 min read
Installing and configuring logging with Rancher is quite easy, but in combination with Splunk some guidance might be helpful. I guide you trough the process of the complete installation and configuration
Rancher Logging
The Banzai Cloud Logging operator now powers Rancher’s logging solution in place of the former, in-house solution.
For an overview of the changes in v2.5, see this section. For information about migrating from Logging V1, see this page.
→ see Rancher Docs: Rancher Integration with Logging Services for details
Installation
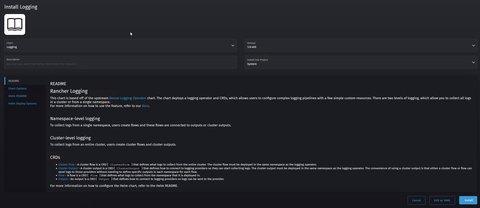
Go to “Apps & Marketplace” in “Cluster Explorer” and select “Logging”
Configure as follows:


Click “Install”
Cluster logging
Cluster logging requires:
We will log everything to Splunk. For that we first need a secret
context=xxx
echo -n '{splunk token}' > ./splunk_token.pass
kubectl create secret generic splunk-token \
    --from-file=token=./splunk_token.pass \
    -n cattle-logging-system \
    --context $context
The secret contains the correct token for the index, source and sourcetype we will use below. Once the secret is in place, we can apply the following config:
# Splunk configuration
# token and sourcetype have to match
apiVersion: logging.banzaicloud.io/v1beta1
kind: ClusterOutput
metadata:
  name: "splunk-k8s"
  namespace: "cattle-logging-system"
spec:
  splunkHec:
    hec_host: splunk.intra
    hec_port: 8888
    hec_token:
      valueFrom:
        secretKeyRef:
          name: splunk-token
          key: token
    insecure_ssl: true
    protocol: https
    index: k8s_test
    source: http:k8s
    sourcetype: k8s:test
    buffer:
      flush_interval: 60s
      flush_mode: interval
      flush_thread_count: 4
      queued_chunks_limit_size: 300
      type: file
---
# Forward all logs to splunk
apiVersion: logging.banzaicloud.io/v1beta1
kind: ClusterFlow
metadata:
  name: "all-logs"
  namespace: "cattle-logging-system"
spec:
  globalOutputRefs:
    - "splunk-k8s"
  match:
    - select: {}
Some things to notice:
- The
ClusterOuutputsplunk-k8s- points to the splunk endpoint
- uses
hce_token - uses
insecure_ssl: truecause our splunk uses self-signed certificates - includes a
bufferconfiguration
- The
ClusterFlowshall select all logs, thus ensureselect: {}is defined undermatch
Struggles and findings
We had/have some issues in order to get logging working properly.
Buffer configuration
Without the buffer we would see errors in the rancher-logging-fluentd-0.log:
021-08-24 06:16:36 +0000 [warn]: #0 [clusterflow:cattle-logging-system:all-logs:clusteroutput:cattle-logging-system:splunk-k8s] failed to flush the buffer. retry_time=0 next_retry_seconds=2021-08-24 06:16:37.747491878 +0000 chunk="5ca480f6ae4aa80e7b39edd2403bc01d" error_class=RuntimeError error="Server error (503) for POST https://splunk-hec-lb.intra:8888/services/collector, response: {\"text\":\"Server is busy\",\"code\":9,\"invalid-event-number\":10}"
  2021-08-24 06:16:36 +0000 [warn]: #0 /usr/lib/ruby/gems/2.7.0/gems/fluent-plugin-splunk-hec-1.2.5/lib/fluent/plugin/out_splunk_hec.rb:323:in `write_to_splunk'
  2021-08-24 06:16:36 +0000 [warn]: #0 /usr/lib/ruby/gems/2.7.0/gems/fluent-plugin-splunk-hec-1.2.5/lib/fluent/plugin/out_splunk.rb:100:in `block in write'
  2021-08-24 06:16:36 +0000 [warn]: #0 /usr/lib/ruby/2.7.0/benchmark.rb:308:in `realtime'
  2021-08-24 06:16:36 +0000 [warn]: #0 /usr/lib/ruby/gems/2.7.0/gems/fluent-plugin-splunk-hec-1.2.5/lib/fluent/plugin/out_splunk.rb:99:in `write'
  2021-08-24 06:16:36 +0000 [warn]: #0 /usr/lib/ruby/gems/2.7.0/gems/fluentd-1.11.5/lib/fluent/compat/output.rb:131:in `write'
  2021-08-24 06:16:36 +0000 [warn]: #0 /usr/lib/ruby/gems/2.7.0/gems/fluentd-1.11.5/lib/fluent/plugin/output.rb:1136:in `try_flush'
  2021-08-24 06:16:36 +0000 [warn]: #0 /usr/lib/ruby/gems/2.7.0/gems/fluentd-1.11.5/lib/fluent/plugin/output.rb:1442:in `flush_thread_run'
  2021-08-24 06:16:36 +0000 [warn]: #0 /usr/lib/ruby/gems/2.7.0/gems/fluentd-1.11.5/lib/fluent/plugin/output.rb:462:in `block (2 levels) in start'
  2021-08-24 06:16:36 +0000 [warn]: #0 /usr/lib/ruby/gems/2.7.0/gems/fluentd-1.11.5/lib/fluent/plugin_helper/thread.rb:78:in `block in thread_create'
Important is also to notice, that you have to add tags: "[]" due to
issue #71, otherwise the buffer configuration will not be applied.
Here is the command to check the logs inside the pod:
kubectl exec -it -n cattle-logging-system rancher-logging-fluentd-0 -- sh -c "cat /fluentd/log/out"Missing log details
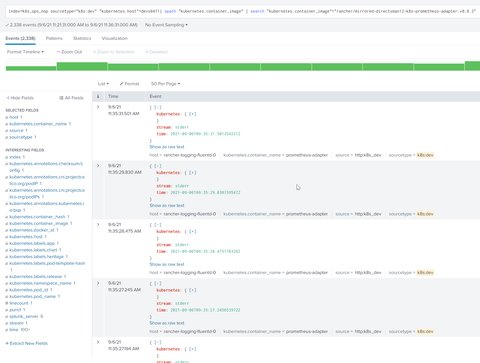
After the configuration is done, we can actually observe the logs appearing in Splunk, but not as we expect. If you check for example the logs from the rancher-monitoring-prometheus-adapter-5ccd6c5759-nxb2m-pod you would see something like this
E0906 09:30:17.854527 1 status.go:71] apiserver received an error that is not an metav1.Status: &errors.errorString{s:"http2: stream closed"}
E0906 09:30:17.855085 1 writers.go:107] apiserver was unable to write a JSON response: http2: stream closed
E0906 09:30:17.856010 1 writers.go:120] apiserver was unable to write a fallback JSON response: http2: stream closed
I0906 09:30:17.857140 1 httplog.go:89] "HTTP" verb="GET" URI="/apis/custom.metrics.k8s.io/v1beta1" latency="15.472113ms" userAgent="Go-http-client/2.0" srcIP="10.42.2.0:61207" resp=200
E0906 09:30:17.857252 1 writers.go:107] apiserver was unable to write a JSON response: http2: stream closed
E0906 09:30:17.858925 1 status.go:71] apiserver received an error that is not an metav1.Status: &errors.errorString{s:"http2: stream closed"}
E0906 09:30:17.859995 1 status.go:71] apiserver received an error that is not an metav1.Status: &errors.errorString{s:"http2: stream closed"}
E0906 09:30:17.860381 1 writers.go:107] apiserver was unable to write a JSON response: http2: stream closed
E0906 09:30:17.861220 1 writers.go:120] apiserver was unable to write a fallback JSON response: http2: stream closed
E0906 09:30:17.862333 1 writers.go:120] apiserver was unable to write a fallback JSON response: http2: stream closed
E0906 09:30:17.863421 1 status.go:71] apiserver received an error that is not an metav1.Status: &errors.errorString{s:"http2: stream closed"}
I0906 09:30:17.864602 1 httplog.go:89] "HTTP" verb="GET" URI="/apis/custom.metrics.k8s.io/v1beta1" latency="20.585726ms" userAgent="Go-http-client/2.0" srcIP="10.42.2.0:61207" resp=200
I0906 09:30:17.865716 1 httplog.go:89] "HTTP" verb="GET" URI="/apis/custom.metrics.k8s.io/v1beta1" latency="19.650812ms" userAgent="Go-http-client/2.0" srcIP="10.42.2.0:61207" resp=200
E0906 09:30:17.866709 1 writers.go:120] apiserver was unable to write a fallback JSON response: http2: stream closed
I0906 09:30:17.867897 1 httplog.go:89] "HTTP" verb="GET" URI="/apis/custom.metrics.k8s.io/v1beta1" latency="21.845435ms" userAgent="Go-http-client/2.0" srcIP="10.42.2.0:61207" resp=200
I0906 09:30:18.479378 1 httplog.go:89] "HTTP" verb="GET" URI="/healthz" latency="5.625602ms" userAgent="kube-probe/1.20" srcIP="10.123.45.140:53476" resp=200
I0906 09:30:20.951747 1 reflector.go:530] k8s.io/apiserver/pkg/authentication/request/headerrequest/requestheader_controller.go:172: Watch close - *v1.ConfigMap total 0 items received
I0906 09:30:21.491742 1 httplog.go:89] "HTTP" verb="GET" URI="/healthz" latency="4.542106ms" userAgent="kube-probe/1.20" srcIP="10.123.45.140:53492" resp=200
I would expect to see these lines in splunk, but all I see is something like stream: stderr rather than the actual message

Unfortunately this issue has not yet been resolved,
Searching for an answer I found some strange behaviour. One is that some of the aggregator-pods show either
2021/09/07 06:36:21] [error] [upstream] connection #40 to rancher-logging-fluentd.cattle-logging-system.svc:24240 timed out after 10 seconds
[2021/09/07 06:36:22] [error] [upstream] connection #40 to rancher-logging-fluentd.cattle-logging-system.svc:24240 timed out after 10 seconds
[2021/09/07 06:36:24] [error] [upstream] connection #40 to rancher-logging-fluentd.cattle-logging-system.svc:24240 timed out after 10 seconds
[2021/09/07 06:36:25] [error] [upstream] connection #40 to rancher-logging-fluentd.cattle-logging-system.svc:24240 timed out after 10 seconds
[2021/09/07 06:36:25] [error] [io] TCP connection failed: rancher-logging-fluentd.cattle-logging-system.svc:24240 (Connection reset by peer)
… while other complain about
[2021/09/07 06:23:30] [error] [output:forward:forward.0] could not write forward header
[2021/09/07 06:23:30] [ warn] [engine] failed to flush chunk '1-1630995807.687826007.flb', retry in 7 seconds: task_id=0, input=tail.0 > output=forward.0
[2021/09/07 06:23:37] [ info] [engine] flush chunk '1-1630995807.687826007.flb' succeeded at retry 1: task_id=1, input=tail.0 > output=forward.0
I currently sorting this out with the help of the Rancher Support team, which suspects it might be related to this issue.
Conclusion
While I like the new way of Rancher has integrated the logging as it is not tightly coupled to Rancher as before and it offers much more flexibility by using Flows and ClusterFlows. However as it seems the configuration is not only tricky in my case ut also for others: [Rancher2] Logging v2 ClusterFlow, ClusterOutput, Flow, Output Examples and Best Practices.
Also one negative aspect is that the available version of the components i.e. Banzai Cloud Logging operator, depend on the version of Rancher and thus, even so there are newer versions of the components available which may contain important bugfixes, you are not yet able to use it.

