Introduction to Grafana Cloud
Posted on May 30, 2022 by Adrian Wyssmann ‐ 5 min read
post was initially published in May 2021
If you have servers you definitively want to collect logs in a central place and store them for some time, so you can investigate what happens in case of issues. I personally rely on logz.io, but Grafana Cloud looks like a promising alternative
What is Grafana and Grafana Cloud
Grafana is the probably the most popular open source analytics and interactive visualization web application, which allows you to connect a variety of sources. One of these is Loki, a log aggregation system inspired by Grafana. WIth Grafana Cloud, the company behind offers their tools a hosted service. They have a similar price model as logz.io and also offers a free tire, which includes:
- 10,000 series for Prometheus or Graphite metrics
- 50 GB of logs
- 14-day retention for metrics and logs
- Access for up to 3 team members
- 3 Users
- 10 Alerts
That is amazing and definitively more than enough for me.

How to get started?
As mentioned, Grafana consumes sources, so you have to first configure a source - Loki in my case, as I want to consume logs. Unfortunately, it’s not very clear.
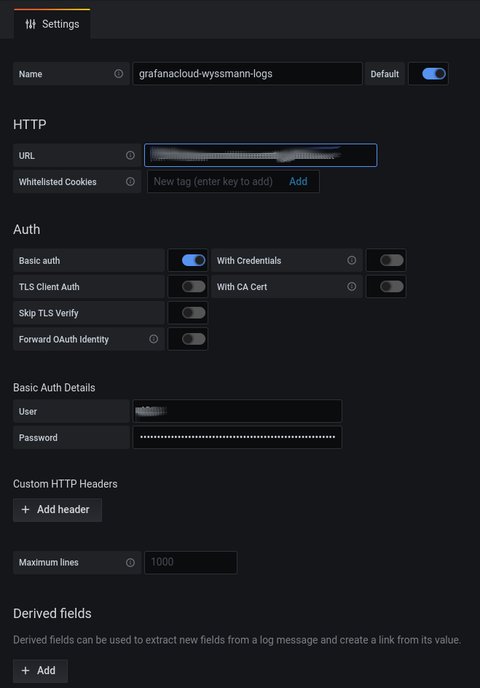
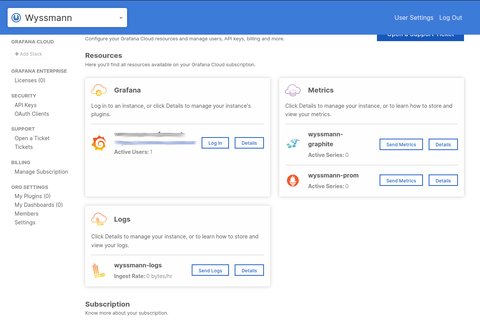
I had to ask in the community, which answered my quite quickly. However, the onboarding steps did not work for me, so what I had to do is create a free trial. Once done, I found the required information (url, username and password) in the account settings
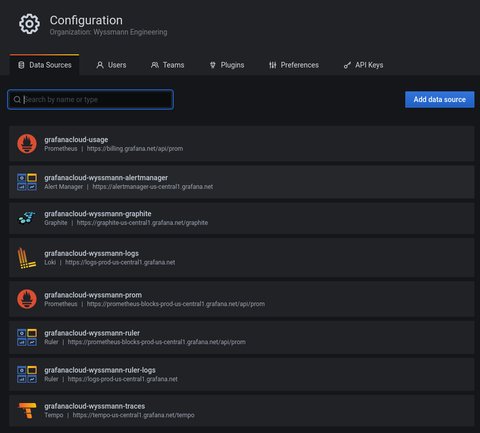
Even better, I actually did not have to configure anything, as the datasources - which are part of the trial - are already configured:
How to forward logs?
In contrary to [logz-io] there is no way to simply forward syslogs. One has to use an agent, whereas promtail is recommended. This page describe the configuration required for the different log types, e.g. Syslog.
To configure my servers, I use the ansible role patrickjahns.promtail: https://github.com/patrickjahns/ansible-role-promtail/) with a configuration like this:
- hosts: dev0001
  roles:
    - role: patrickjahns.promtail
      vars:
        promtail_config_server:
          http_listen_port: 0
          grpc_listen_port: 0
        promtail_loki_server_url: "https://xxxxx:[email protected]"
        promtail_config_positions:
          filename: "{{ promtail_positions_directory }}/positions.yaml"
          sync_period: "60s"

        promtail_config_scrape_configs:
        - job_name: journal
          journal:
            max_age: 12h
            labels:
              job: systemd-journal
              host: "{{ inventory_hostname }}"
          relabel_configs:
            - source_labels: ['__journal__systemd_unit']
              target_label: 'unit'
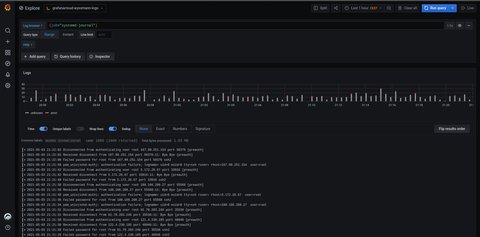
Once promtail was setup and running, I could check Grafana. As I was used to Kibana and the dashboard shown in logz.io, I was surprised that I don’t see anything. However, I quickly figured out that you have to select {job="systemd-journal"} to see something.
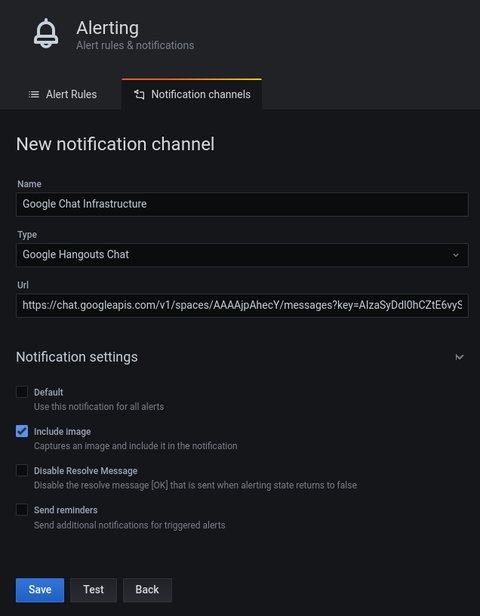
As I did or logz.io, I also setup notifications for Google Chat. This is actually a supported endpoint, so I only had to provide an url:
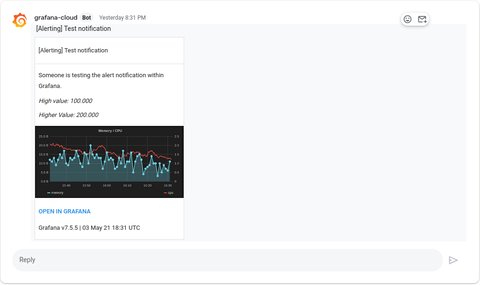
A quick test, showed a successful notification message incl. a graph:
How to query logs?
Before you understand how to query logs (or metrics) you should read this article to understand the differences to the ELK (Elasticsearch, Kibana) stack
Logs are stored in plaintext form tagged with a set of label names and values, where only the label pairs are indexed. This tradeoff makes it cheaper to operate than a full index and allows developers to aggressively log from their applications. Logs in Loki are queried using LogQL. However, because of this design tradeoff, LogQL queries that filter based on content (i.e., text within the log lines) require loading all chunks within the search window that match the labels defined in the query.
LogQL is different from Query DSL: LogQL uses labels and operators for filtering.
There are two types of LogQL queries:
- [Log queries(https://grafana.com/docs/loki/latest/logql/#log-queries)] return the contents of log lines.
- Metric queries extend log queries and calculate sample values based on the content of logs from a log query.
Log Queries
A basic log query consists of two parts:
- log stream selector - mandatory, determines how many log streams (unique sources of log content, such as files) will be searched
- log pipeline - optional, expressions chained together and applied to the selected log streams
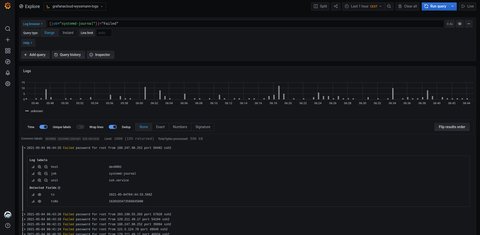
As you read above I had to enter {job="systemd-journal"}, which is the log stream source. I can extend this by the log pipeline to filter data for example
Metric Queries
LogQL also supports wrapping a log query with functions that allow for creating metrics out of the logs. For example the following query counts all the log lines within the last five minutes for the MySQL job.
count_over_time({job="mysql"}[5m])Checkout the documentation for more details.
Metrics
Now that we are at it, what about metrics? Well to collect metrics pne hast to use the Grafana Agent. The same agent can also be used to collect logs, so I don’t need two distinct services running. However, as I don’t want to install the agent manually, I have to further investigate whether there is an ansible role available, thus I will definitively have follow up on this.
What’s next
I am used to logz.io for my logs and quite common with the Query DSL. At the moment I will have both services in parallel and see how they compare to each other. I also want to enhance my monitoring to use metrics - logz.io also offer metrics, but I did not use it yet. So stay tuned, I will dedicate a different post on the metrics topic.