Introduction to Grafana
Posted on May 30, 2022 by Adrian Wyssmann ‐ 5 min read
A recently I introduced you to Grafana Cloud. Some of you might know what Grafana is and what it offers. For the ones who don’t, let me introduce it.
What is Grafana?
As mentioned in my previous post, Grafana is a very popular open source projects which let’s you query, visualize and alert on metrics and logs. Grafana hs a pluggable data source model
Grafana has a pluggable data source model and comes bundled with rich support for many of the most popular time series databases like Graphite, Prometheus, Elasticsearch, OpenTSDB, and InfluxDB. It also has built-in support for cloud monitoring vendors like Google Stackdriver, Amazon Cloudwatch, and Microsoft Azure, and SQL databases like MySQL and Postgres. Grafana is the only tool that can combine data from so many places into a single dashboard.
Ultimately you can monitor applications and infrastructure assets.
Installation
Grafana runs on Linux, macOS and Windows and you can detailed documentation on how to install here here. Alternatively you can use Grafana Cloud, which offers you an all-in one solution, where you don’t have to worry about installing anything.
If you want an instance to play around, I recommend to follow the the Grafana Tutorial: Fundamentals, which offers a docker-compose file to setup a playground locally on your PC, which is running in docker.
How does it work?
Their documentation is really great, thus I recommend to start with the Getting started with Grafana and then the Grafana Tutorial: Fundamentals. I try to summarize, what is important to get a better understanding for myself.
Before you can start visualization of data you need a Datasource/ Datasources which provide the data to visualize. Grafana iteslf does not store data (metrics, logs). Grafana includes built-in support for Prometheus, one of the most prominent datasources, which I already talked about in my post “Introduction to Prometheus”. For details on how to configure check Prometheus Datasource
Dashboards
Once you have connected your Datasource, you can start creating Dashboards Dashboard - I recommend to watch A beginner’s guide to good Grafana dashboard design. Ideally a Dashboard tells a story, which allows you or you team to answer certain questions about the state of your applications, so do this
- try to answer a question
- make a query and based on the knowledge you gather
- make further more specific queries
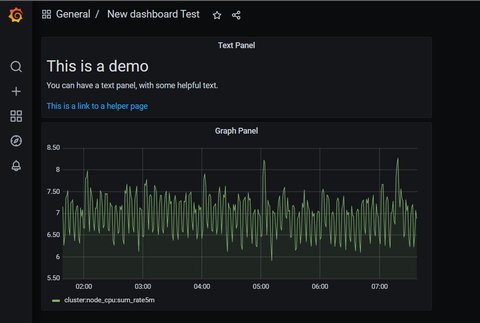
A Dashboard is a set of one or more panels organized and arranged into one or more rows.
A panel is the basic visualization building block in Grafana. Each panel visualizes data from a specific data source based on the defined query.
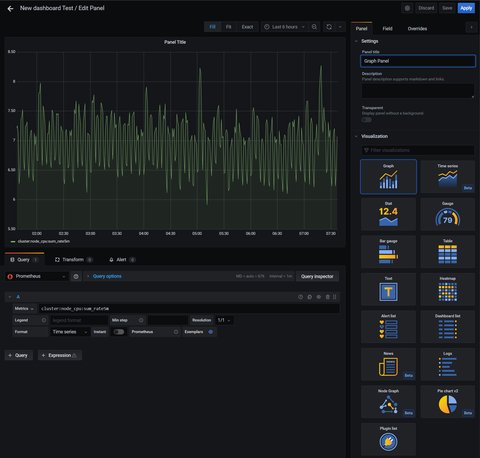
Here our dashboard with 2 panels, 1 graph panel and one text panel:
There is an Explore mode which helps you to create ad-hoc queries.
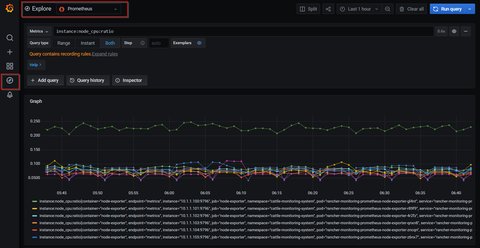
It’s important to understand, that each data source has its own query editor, optimized for the data source. This means, that you can youse the data source specific query language. In case of Prometheus as a data source, you would use Prom QL.
Types of visualizations
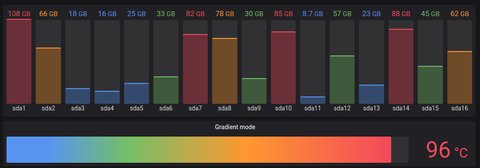
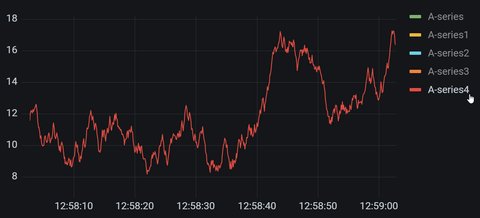
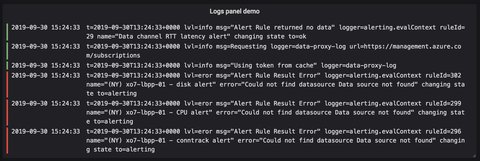
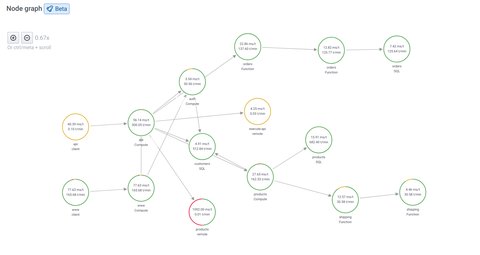
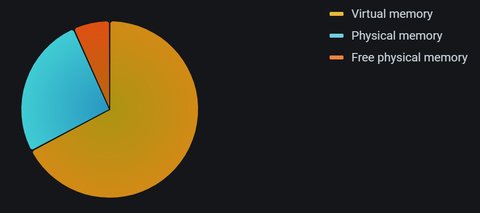
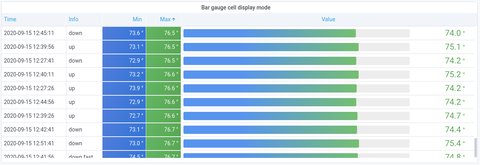
Grafana offers a bunch of Visualizations, all extensively customizable:
You can add Annotations to mark important points, which are marked in the graph - here in blue
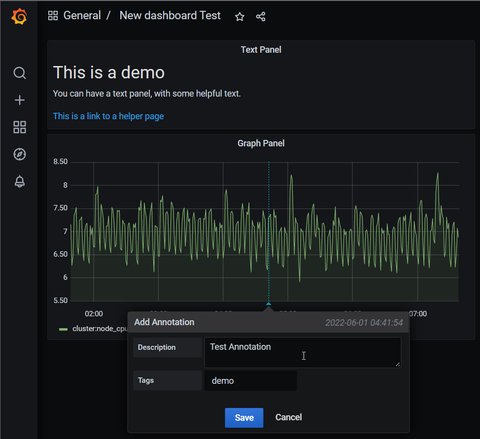
Grafana also allows you to create such Annotations automatically, based on a certain expression.
At last, you can also create Playlists, i.e. dashboards that are displayed in a sequence. One use case might be to present your metric to teams or visitor or having a developer dashboard.
When creating dashboards, you might want to make them more dynamic by using Templates and Variables:
- template: a query that contains a variable
- variable: placeholder for a value
Variables can be used in metric queries and in panel titles. The variable can be changed by changing the value in the dropdown, on the top of the dashboard.
Alerting
Alerting is part of Grafana since some time, but with Grafana 8.0 the Grafana alerting has been improved. It consists of four key components:
- Alerting rule - Evaluation criteria that determine whether an alert will fire. It consists of one or more queries and expressions, a condition, the frequency of evaluation, and optionally, the duration over which the condition is met.
- Contact point - Channel for sending notifications when the conditions of an alerting rule are met.
- Notification policy - Set of matching and grouping criteria used to determine where and how frequently to send notifications.
- Silences - Date and matching criteria used to silence notifications.
Alertmanager is embedded into core Grafana and used by default for notifications and alerts. However, it also support external Alertmanager by adding such a data source. So far I never used the embedded one, but only an external one. I will cover Alertmanager in a separate post.
Sum up
In this post I had a look at Grafana and how I can visualize my metrics. But there is more, which I did not cover here, like a Authentication and Alerting. Still, we can see what powerful vizualization tool Grafana is, especially also cause it offers support for a lot of different datasources:

