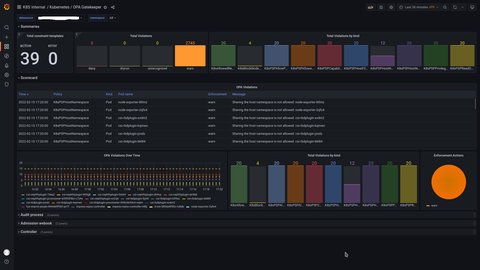
OPA Gatekeeper Metrics and Grafana Dashboard
Posted on October 29, 2022 by Adrian Wyssmann ‐ 2 min read
Now, as we have installed OPA Gatekeeper in our clusters successfully, I wonder how to get metrics in Prometheus and show them in Grafana Dashboard
Gatekeeper Metrics
When looking at the documentation, both the gatekeeper-controller-manager and gatekeeper-audit deployments expose a metrics port for Prometheus scrapping. These metrics endpoints are not exposed via a Kubernetes service, so the user has to create [PodMonitor] resources, to configure the rancher-monitoring Prometheus instance to scrape metrics from them.
This issue explains the difference of both resources:
- [ServiceMonitor], which declaratively specifies how groups of services should be monitored. The Operator automatically generates Prometheus scrape configuration based on the definition. It will scrape all pods behind the service, because the Service maintains an
Endpointsobject. - [PodMonitor], which declaratively specifies how groups of pods should be monitored. The Operator automatically generates Prometheus scrape configuration based on the definition.
Based on this example, I create this resource in the cluster:
resource "kubernetes_manifest" "opa_podmonitor" {
  manifest = {
    apiVersion = "monitoring.coreos.com/v1"
    kind = "PodMonitor"
    metadata = {
      name = "opa-pod-monitor"
      namespace = "cattle-gatekeeper-system"
    }
    spec = {
      selector = {
        matchLabels = {
          "gatekeeper.sh/operation" = "audit"
        }
      }
      podMetricsEndpoints = [{
          port = "metrics"
      }]
    }
  }
}
Grafana Dashboard
Once you have the metrics in Prometheus you can create a dashboard in Grafana. I actually found this gatekeeper dashboard provided by Grafana itself:
resource "kubernetes_config_map" "gatekeeper_dashboard" {
  metadata {
    name      = "opa-gatekeeper-dashboard"
    namespace = "cattle-gatekeeper-system"
    labels = {
      team = "skywalkers"
      grafana_dashboard = "1"
    }
  }
  data = {
    "opa-gatekeeper-dashboard.json" = "${file("${path.module}/opa-gatekeeper-dashboard.json")}"
  }
}