Microsoft Azure: Observability
As part of the Microsoft Enterprise Skills Initiative I am looking into different topics in Azure and summarize my learnings. This post is about Azure Observability
Observability Service Overview
Azure offers the following services to monitor your Azure resources:
Azure Advisor evaluates your Azure resources and makes recommendations for all your subscriptions, to help improve reliability, security, and performance, directly available in your Azure Portal. The recommendations are divided into five categories:
- Reliability: Used to ensure and improve the continuity of your business-critical applications.
- Security: Used to detect threats and vulnerabilities that might lead to security breaches.
- Performance: Used to improve the speed of your applications.
- Cost: Used to optimize and reduce your overall Azure spending.
- Operational Excellence: Used to help you achieve process and workflow efficiency, resource manageability, and deployment best practices.
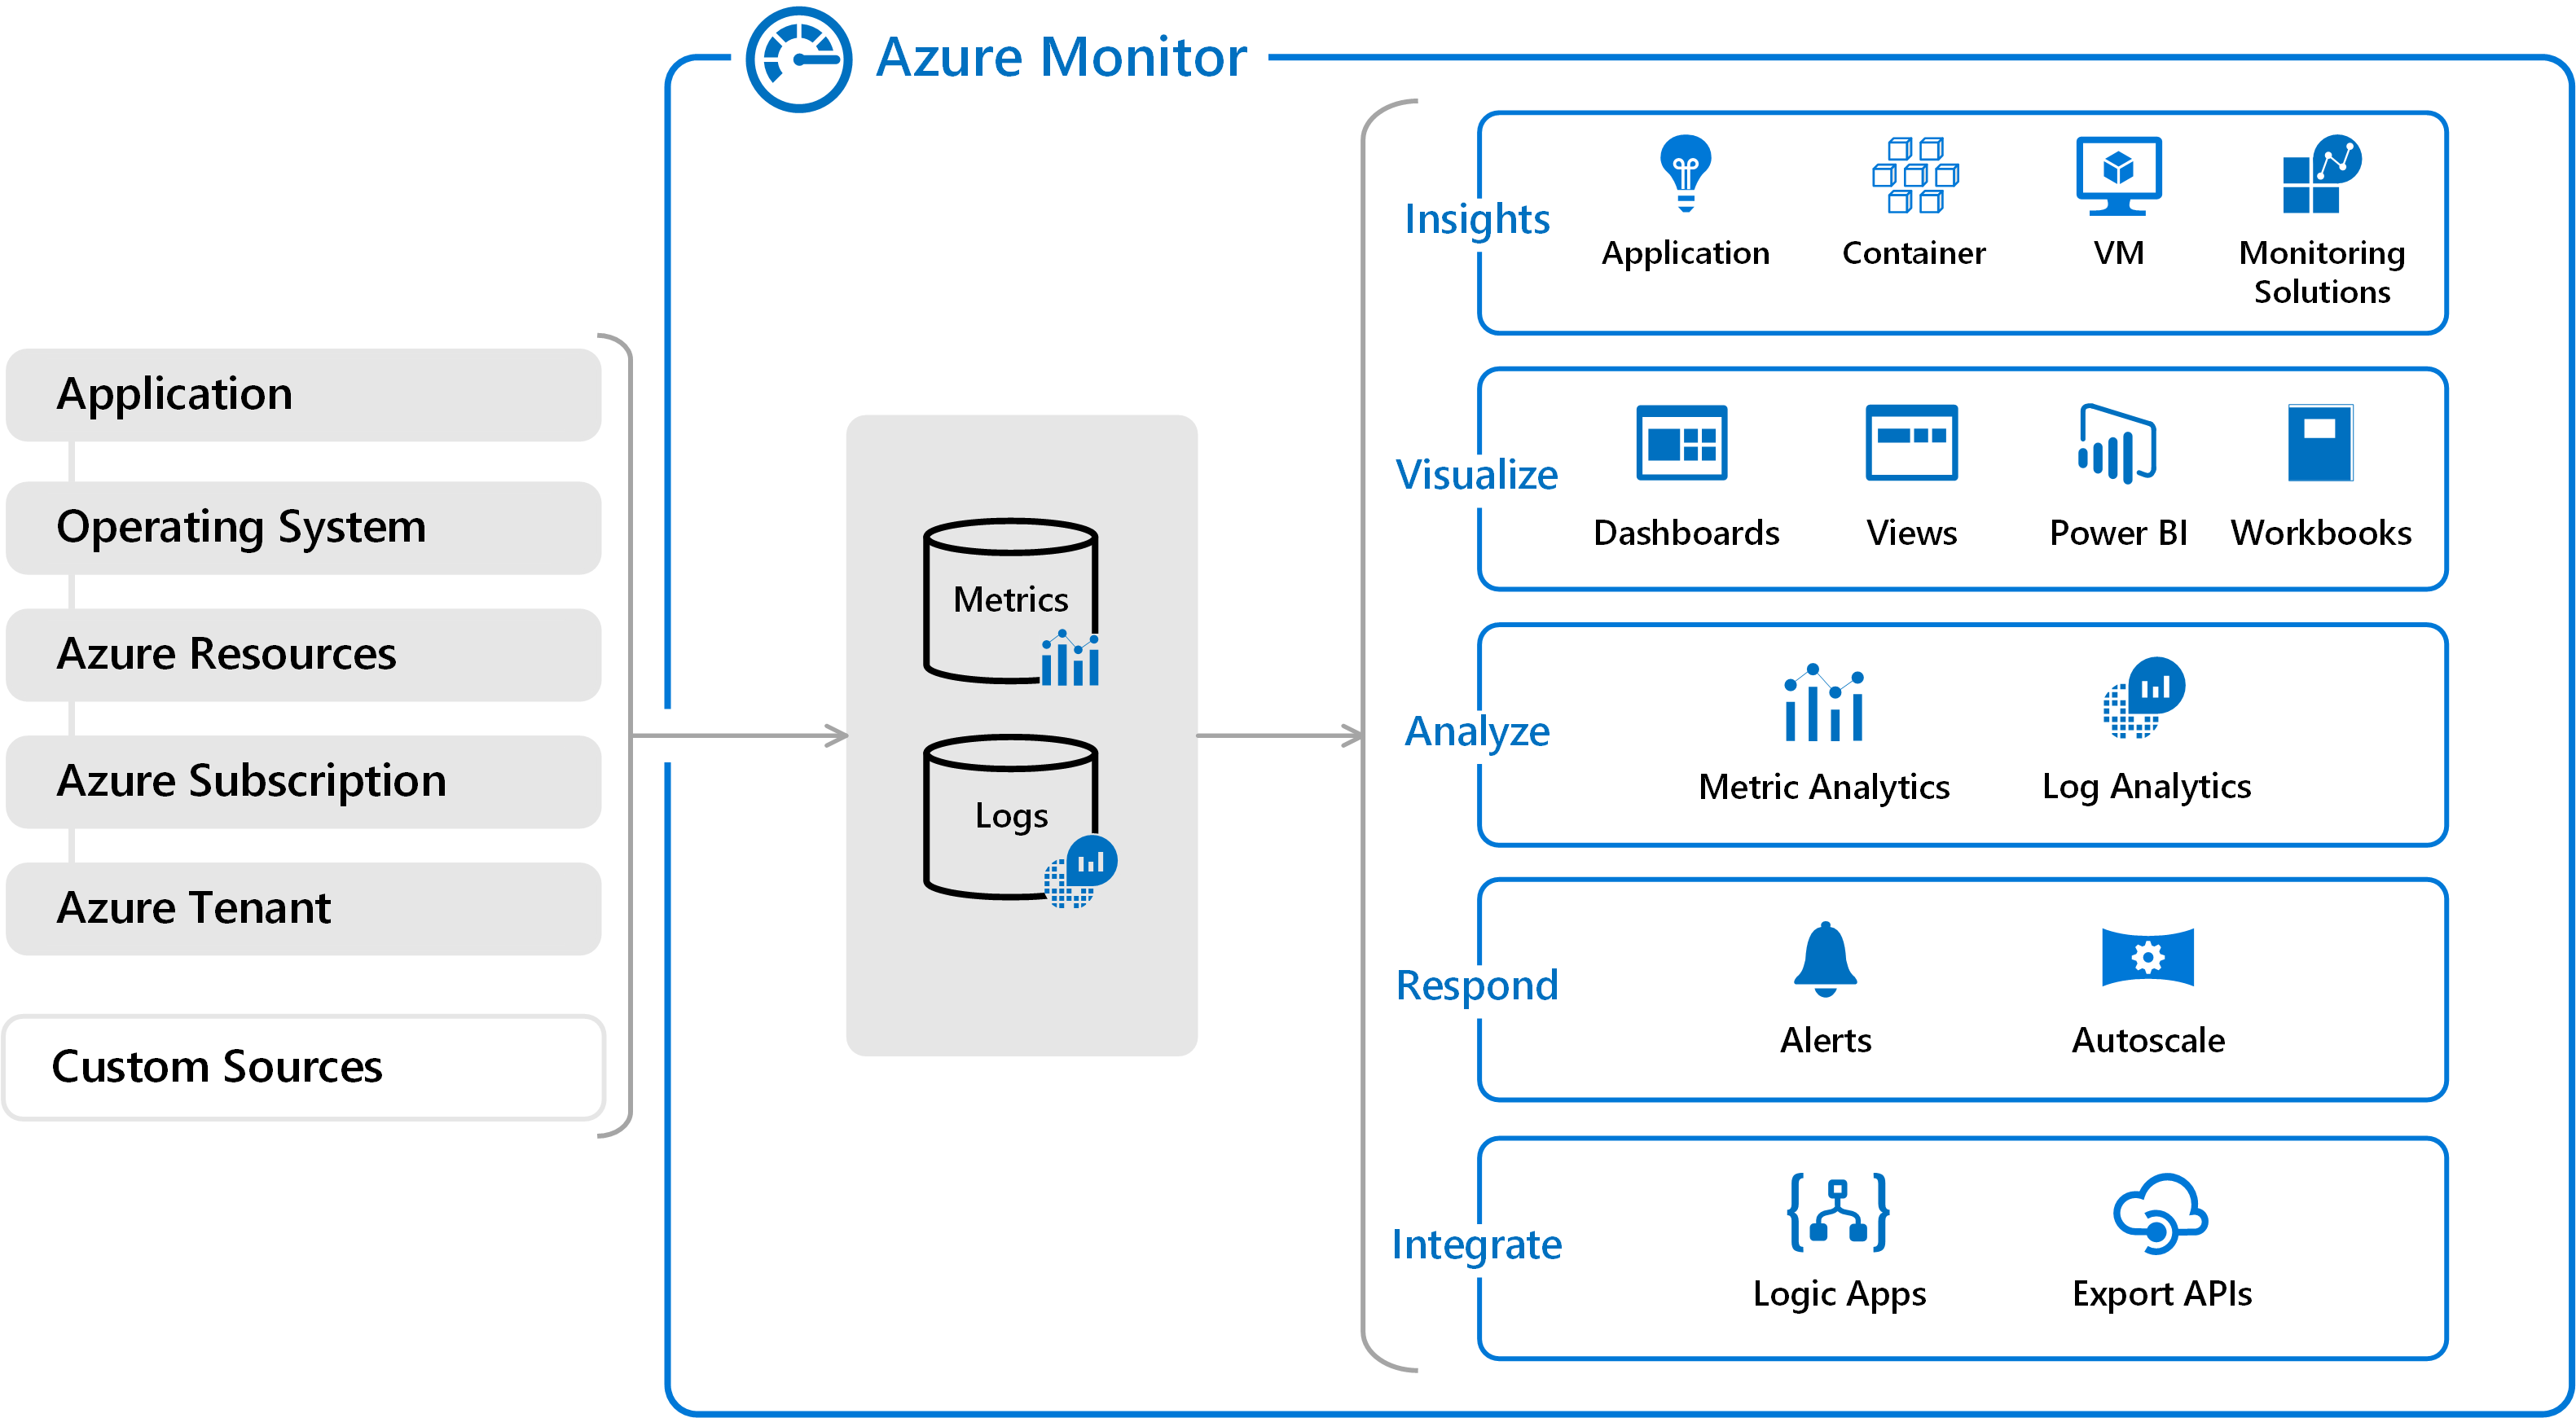
Azure Monitor is an observability platform which helps you to collect, analyze and act on the telemetry data of your cloud and on-premise infrastructure.
-
Application Insights an is an extensible Application Performance Management (APM) service to monitor your live applications, by tracing series of related events that follow a user request through a distributed system. It detects performance anomalies, and includes powerful analytics tools to help you diagnose issues.
-
VM Insights monitors the performance and health of your virtual machines and virtual machine scale sets, including their running processes and dependencies on other resources
-
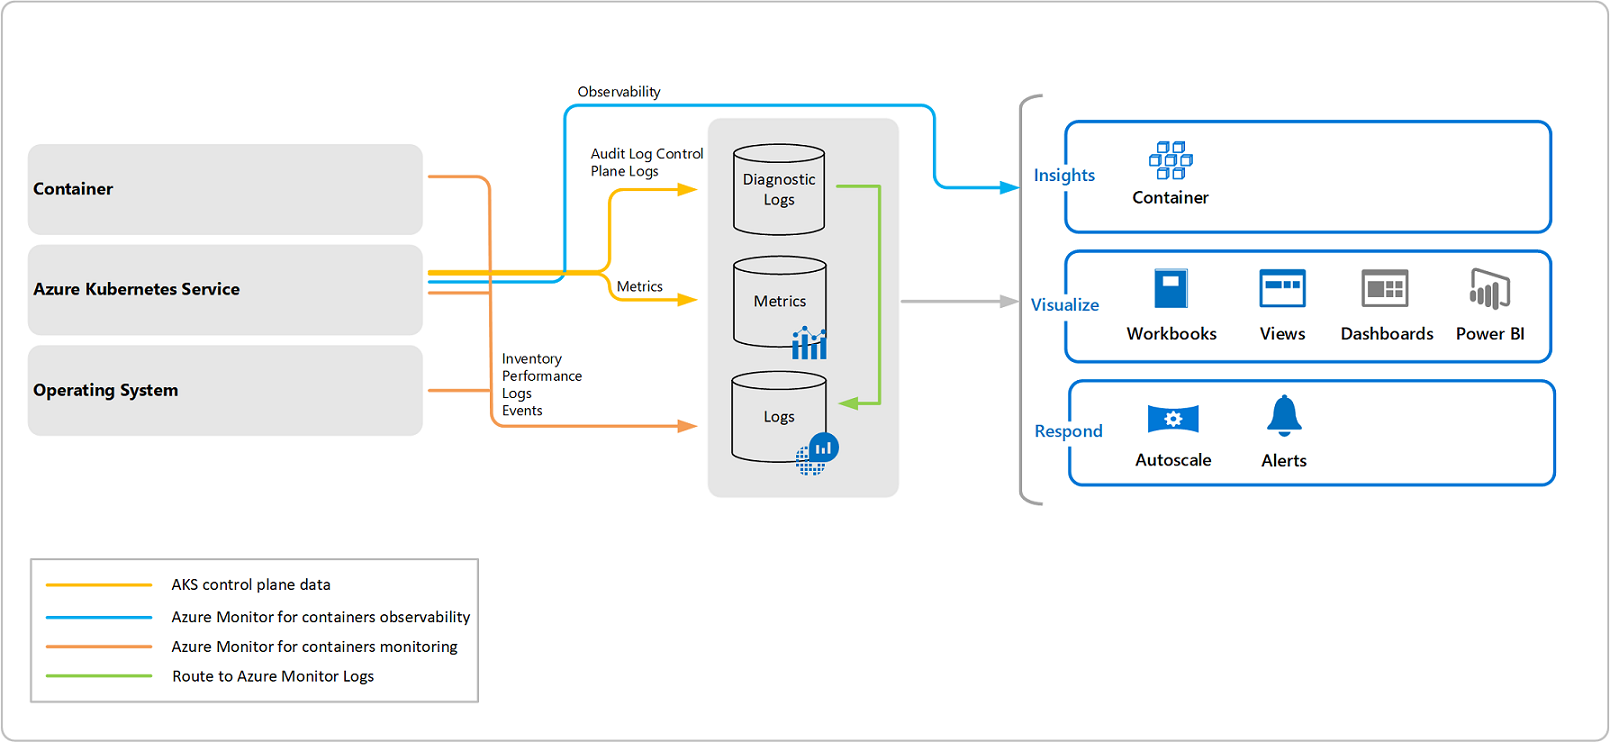
Container insights monitors the performance of container workloads to the Azure container related. It supports clusters running the Linux and Windows Server 2019 operating system incl. container runtimes Docker, Moby, and any CRI compatible runtime (e.g. CRI-O and ContainerD)

Container Insights (c) Microsoft -
Log Analytics, based on Azure Data Explorer, allows you to query logs using Kusto query language (KQL), not only of your resources but also your applications if your data are ingested
-
Offers smart alerts, where related alerts, which represent a single issue, are combined automatically together using machine learning.
-
action rules let you suppress or trigger specific actions
-
Collect data from monitored resources using Azure Monitor Metrics. A metrics are event data (numerics) and thus stores in a time-series database which is optimized for analyzing time-stamped data.
-
Create visualizations with Azure dashboards and workbooks - similar to Grafana Dashboards.
Azure Service Health provides a personalized view of the health of the Azure services, regions, and resources in addition to status.azure.com. It does offer status, official outage root cause analyses (RCAs) and you can set up alerts for outages and planned maintenance of services in the regions which you are using.
App Service application logging
If you are using Azure App Service, it provides built-in [Diagnostic logging] which you can enable - via the app settings in the Azure Portal or azure cli. Can, cause it’s not enabled. This is because as logs are stored into files and thus have a negative impact on performance, as well as it will quickly consume storage. Thus excessive logging should only used for troubleshooting purposes. For this reasons, once logging to the file system is enabled, azure automatically disables it after 12 hours.
Depending on he type of apps (e.g. ASP.NET) and on what type of host (Linux or Windows) the app is running, the logging functionality differs:
- Windows-based app offer rich logging infrastructure (e.g. different trace levels
Error,Warning,Information,Verbose) - Linux-based apps offer basic logging by using redirections to STDERR or STDOUT. Depending on the underlying image (e.g. running PHP, Ruby, …), there may be richer logging functionality available, but these logs can only accessed by accessing the container.
Accessing logs
Logs are usually stored in files on the filesystem or optionally on a Blog storage (available for Windows-based apps only). You can download them form these locations:
- Linux/container apps:
https://<app-name>.scm.azurewebsites.net/api/logs/docker/zip - Windows apps:
https://<app-name>.scm.azurewebsites.net/api/dump
This is offered by [Kudu], which manages deployment and troubleshooting for Azure Web Apps, including options for viewing and downloading log files.
You also cn use the [Azure CLI]:
az webapp log download --log-file \<_filename_\>.zip --resource-group \<_resource group name_\> --name \<_app name_\>
Or, for Windows-based apps which use blog storage, you can also get the logs from the [Azure Storage Explorer].
Alternatively, you can also access the live log stream, using the Azure Portal or [Azure CLI] in order to watch logs in real time:
az webapp log tail --name <app name> --resource-group <resource group name>
Or curl:
curl -u {username} https://{sitename}.scm.azurewebsites.net/api/logstream