If you have servers you definitively want to collect logs in a central place and store them for some time, so you can investigate what happens in case of issues. I personally rely on logz.io
What is logz.io?
logz.io is a monitoring and login service. They have a very clear prizing model and they offer also a Community version for free, which include:
- A fully managed and auto scaling ELK Stack
- Index up to 1 GB of log data
- 10 alerts
- Kibana’s powerful search and visualization capabilities
- ML-powered analytics: Cognitive Insights
- 3 days of log retention
For me as a developer, this is great cause 1GB of log is plenty for my few servers I have.
During the years, they extended their service to offer Metrics and distributed tracing.
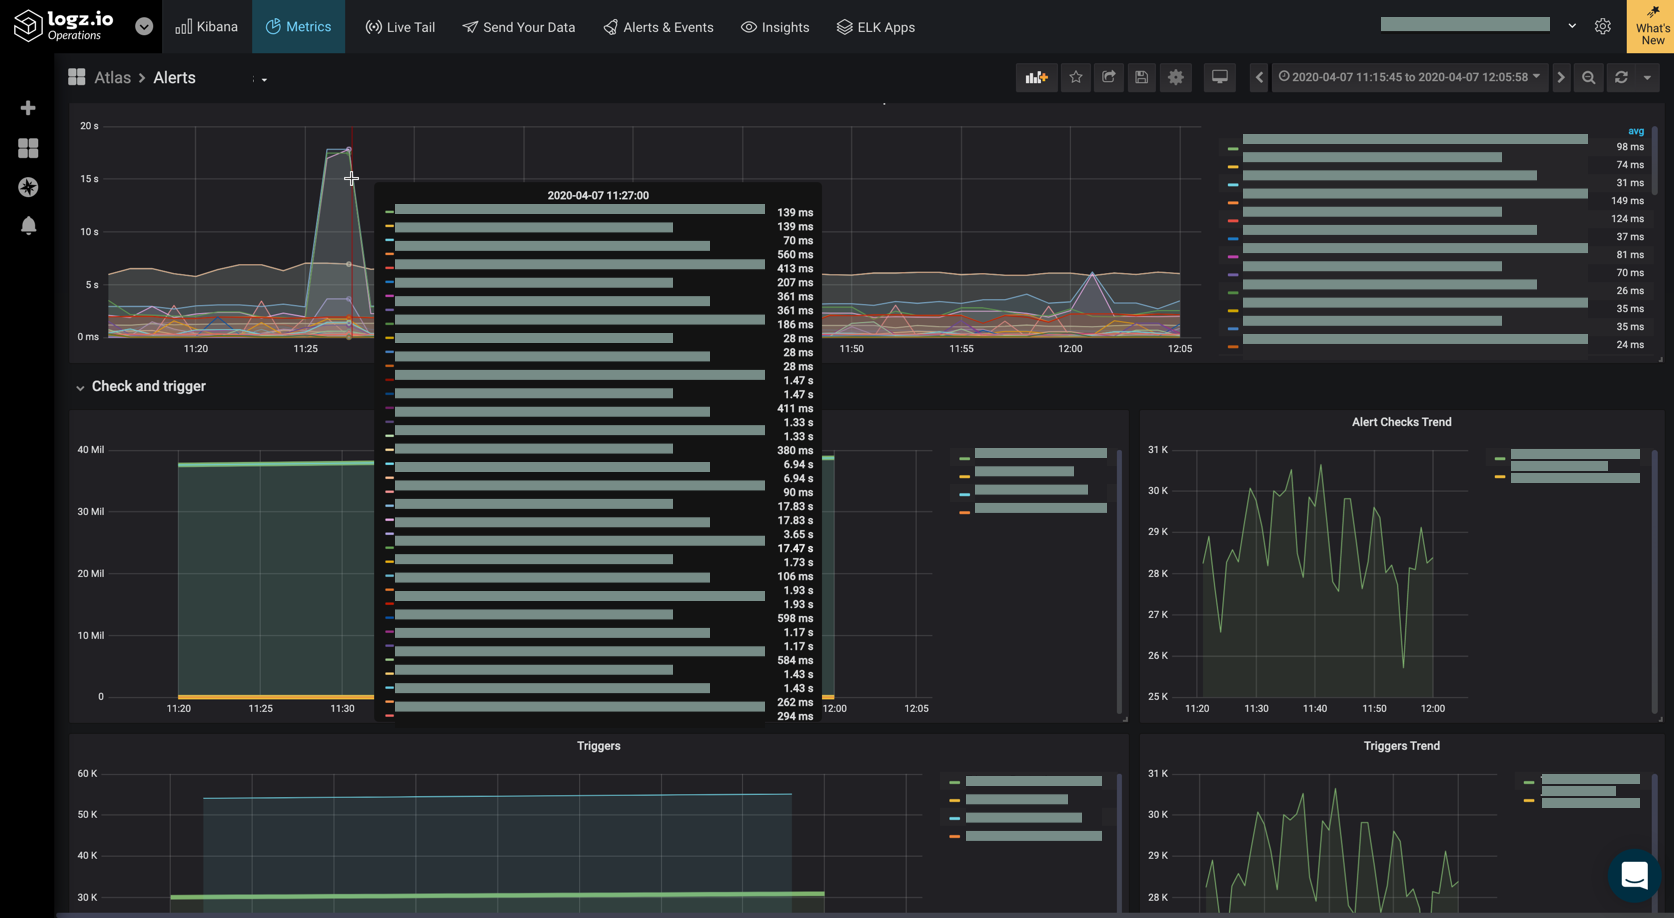
The use open source tools like Elasticsearch and Kibana for the logging service, Prometheus for the Metrics and Jaeger, which is and open source, end-to-end distributed tracing tool used for monitoring and troubleshooting microservices-based distributed systems.
Just recently they announced the switch to OpenSearch and OpenSearch Dashboard for their logging service.
Why I use logz.io
Logging and monitoring is essential - also for my own infrastructure - but I was looking for a place where I can store my logs and have them, even all my servers are down. So I was looking for a service, which is not too expensive - or even free - and offers to send logs (syslog) directly, without having to install a log aggregator. The first service I found was loggly.com which also offers a free tier with longer retention (7 days vs. 3 days) but fewer data (200 MB/day vs. 1GB). I eventually found logz.io, which I simply like more. As mentioned above, they extended their service beyond logging, so it was not the worst choice for me.
How do I use it?
logz.io offers a lot of ways on how you can forward the logs to it’s service:

As I use Linux, forwarding logs using rsyslog is the natural choice for me - read more about rsyslog here. You might already guess, I use ansible to setup the forwarding on my linux nodes.
I also setup some alerts which notify me if something suspicious or unexpected happens. As I use Google Workspace, it’s obvious to use Google Chat as the place to send the alerts. What I have to do is setup a notification endpoint. I had to dig a bit, but it’s actually very simple. Any message in Google Chat is represented as a JSON object., so in order to properly receive a notification in Google Chat you have to configure the following
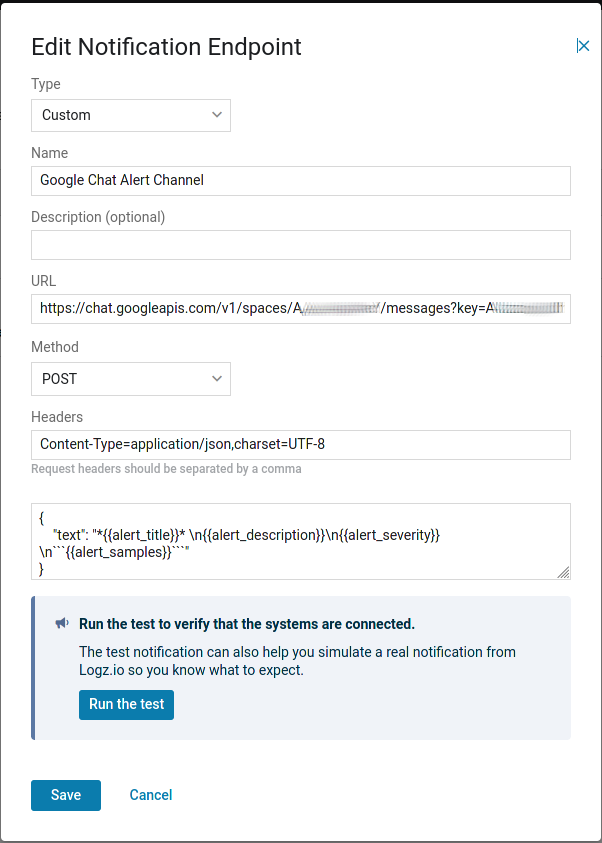
Ensure that header and body are properly set:
-
Headers:
Content-Type=application/json,charset=UTF-8 -
Body:
{
    "text": "*{{alert_title}}* \n{{alert_description}}\n{{alert_severity}}\n```{{alert_samples}}```"
}
Once this is done, I can test if the notifications are properly send - and yes, they are:
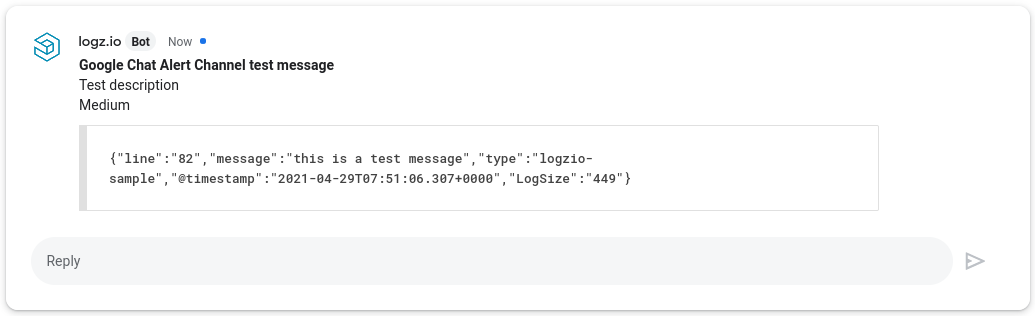
That’s it, I have now a working logging solution for my infrastructure.
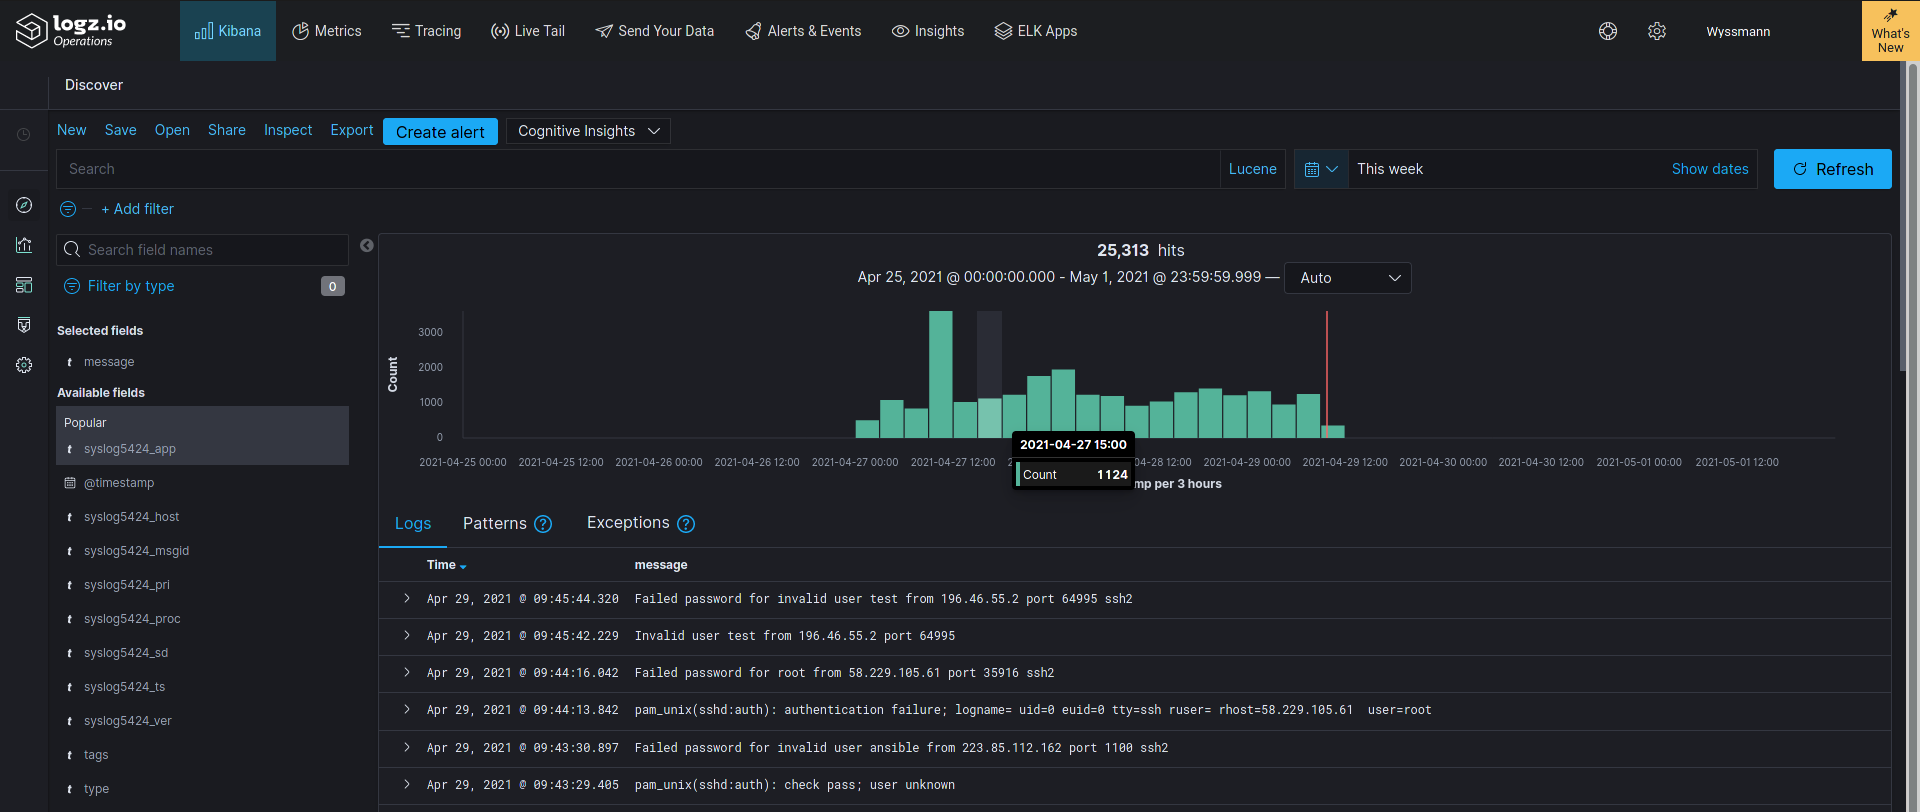
How to query the logs?
To query data you can use either Query DSL (Domain Specific Language) based on JSON or Lucene query language.